こちらはこの章のコード例です。これらのページは現在、時間をかけて更新されています(画像、キャプションの追加、おそらくさらなる例の追加)。更新のためにもう一度訪れてください。もちろん、このページを説明が得られる本と一緒に使用するのが最善の方法です。

図 6.1 – 単純なツリー
\documentclass[tikz,border=10pt]{standalone}
\begin{document}
\begin{tikzpicture}
  \node {A} child { node {1} edge from parent };
\end{tikzpicture}
\end{document}
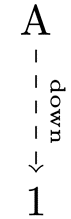
図 6.2 – ツリー内のカスタマイズされたエッジ
\documentclass[tikz,border=10pt]{standalone}
\begin{document}
\begin{tikzpicture}
  \node {A} child { node {1}
    edge from parent [dashed, ->]
    node[above, sloped, font=\tiny] {下} };
\end{tikzpicture}
\end{document}
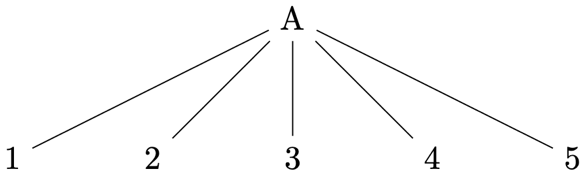
図 6.3 – 5つの子を持つツリー
\documentclass[tikz,border=10pt]{standalone}
\begin{document}
\begin{tikzpicture}
  \node {A}
    child { node {1} }
    child { node {2} }
    child { node {3} }
    child { node {4} }
    child { node {5} }
  ;
\end{tikzpicture}
\end{document}
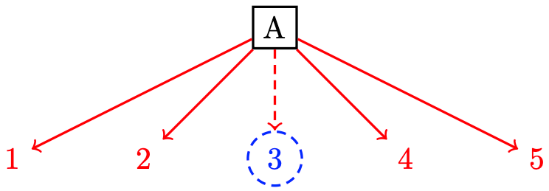
図 6.4 – カスタムスタイルオプションを持つツリー
\documentclass[tikz,border=10pt]{standalone}
\begin{document}
\begin{tikzpicture}[thick]
  \node [draw, black, rectangle] {A}
    [red, ->]
    child { node {1} }
    child { node {2} }
    child [densely dashed]
      { node [draw, blue, circle] {3} }
    child { node {4} }
    child { node {5} }
  ;
\end{tikzpicture}
\end{document}
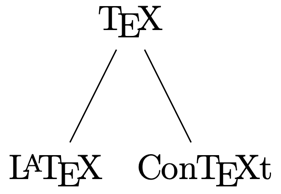
図 6.5 – 最小限のTeX関係ツリー
\documentclass[tikz,border=10pt]{standalone}
\usepackage{hvlogos}
\begin{document}
\begin{tikzpicture}
  \node {\TeX}
    child { node {\LaTeX} }
    child { node {\ConTeXt} }
  ;
\end{tikzpicture}
\end{document}
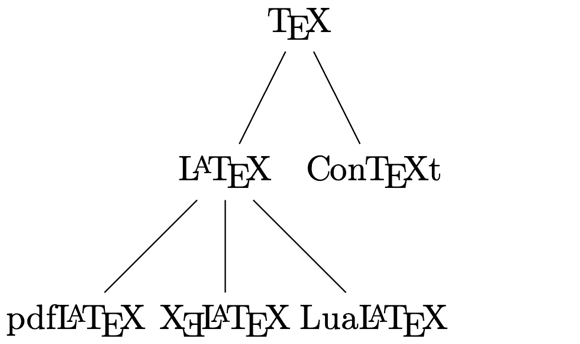
図 6.6 – TeXとLaTeXの関係ツリー
\documentclass[tikz,border=10pt]{standalone}
\usepackage{hvlogos}
\begin{document}
\begin{tikzpicture}
  \node {\TeX}
    child { node {\LaTeX}
      child { node {\pdfLaTeX} }
      child { node {\XeLaTeX} }
      child { node {\LuaLaTeX} }
    }
    child { node {\ConTeXt} }
  ;
\end{tikzpicture}
\end{document}
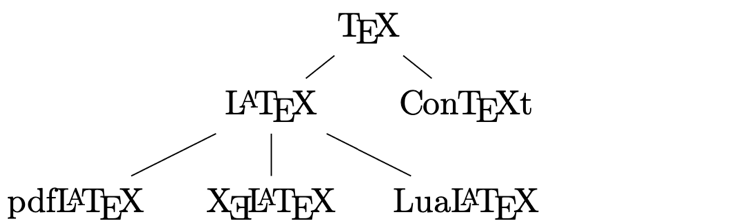
図 6.7 – 調整された距離のツリー
\documentclass[tikz,border=10pt]{standalone}
\usepackage{hvlogos}
\begin{document}
\begin{tikzpicture}[
  level 1/.style = { level distance   = 8mm,
                     sibling distance = 20mm },
  level 2/.style = { level distance   = 10mm,
                     sibling distance = 20mm } ]
  \node {\TeX}
    child { node {\LaTeX}
      child { node {\pdfLaTeX} }
      child { node {\XeLaTeX} }
      child { node {\LuaLaTeX} }
    }
    child { node {\ConTeXt} }
  ;
\end{tikzpicture}
\end{document}
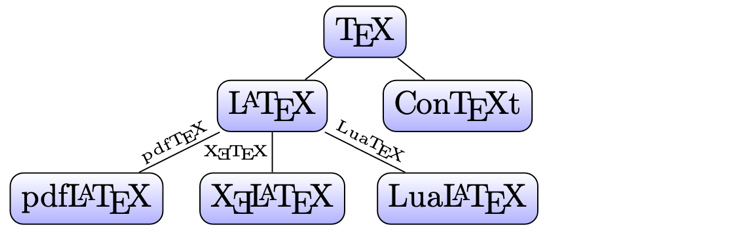
図 6.8 – カラフルなツリー
\documentclass[tikz,border=10pt]{standalone}
\usepackage{hvlogos}
\begin{document}
\begin{tikzpicture}[
  level 1/.style = { level distance = 8mm,
                     sibling distance = 20mm },
  level 2/.style = { level distance = 10mm,
                     sibling distance = 20mm },
  treenode/.style = {shape = rectangle,
    rounded corners, draw,
    top color=white, bottom color=blue!30},
  every child node/.style = {treenode},
  engine/.style = {inner sep = 1pt, font=\tiny, above}
]
\node [treenode] {\TeX}
  child { node {\LaTeX}
    child { node {\pdfLaTeX}
      edge from parent node[engine, sloped] {\pdfTeX}}
    child { node {\XeLaTeX}
      edge from parent node[engine, left]   {\XeTeX} }
    child { node {\LuaLaTeX}
      edge from parent node[engine, sloped] {\LuaTeX}}
  }
  child { node {\ConTeXt} }
;
\end{tikzpicture}
\end{document}
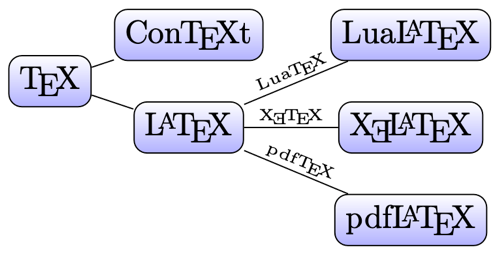
図 6.9 – 左から右へのツリー
\documentclass[tikz,border=10pt]{standalone}
\usepackage{hvlogos}
\begin{document}
\begin{tikzpicture}[
  level 1/.style = { level distance = 16mm,
                     sibling distance = 10mm },
  level 2/.style = { level distance = 30mm,
                     sibling distance = 10mm },
  treenode/.style = {shape = rectangle,
    rounded corners, draw,
    top color=white, bottom color=blue!30},
  every child node/.style = {treenode},
  engine/.style = {inner sep=1pt, font = \tiny, sloped, above},
  grow = right
]
\node [treenode] {\TeX}
  child { node {\LaTeX}
    child { node {\pdfLaTeX} edge from parent node[engine] {\pdfTeX}}
    child { node {\XeLaTeX} edge from parent node[engine] {\XeTeX} }
    child { node {\LuaLaTeX} edge from parent node[engine] {\LuaTeX}}
  }
  child { node {\ConTeXt} }
;
\end{tikzpicture}
\end{document}
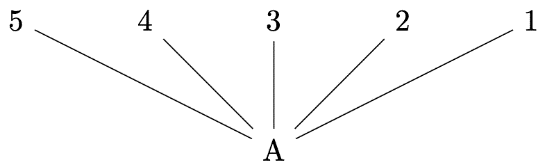
図 6.10 – 上に成長するツリー
\documentclass[tikz,border=10pt]{standalone}
\begin{document}
\begin{tikzpicture}[grow=up]
\node {A}
  child { node {1} }
  child { node {2} }
  child { node {3} }
  child { node {4} }
  child { node {5} }
;
\end{tikzpicture}
\end{document}
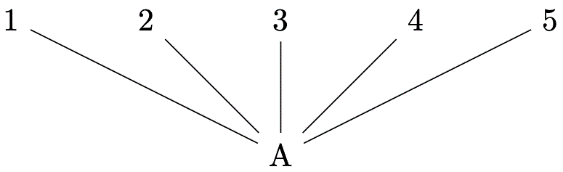
図 6.11 – 子供たちが逆順で成長するツリー
\documentclass[tikz,border=10pt]{standalone}
\begin{document}
\begin{tikzpicture}[grow'=up]
\node {A}
  child { node {1} }
  child { node {2} }
  child { node {3} }
  child { node {4} }
  child { node {5} }
;
\end{tikzpicture}
\end{document}
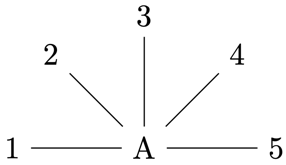
図 6.12 – 円形の子ノード配置を持つツリー
\documentclass[tikz,border=10pt]{standalone}
\usetikzlibrary{trees}
\begin{document}
\begin{tikzpicture}[clockwise from = 180,
  sibling angle=45]
\node {A} child { node {1} };
\node {A}
  child { node {1} }
  child { node {2} }
  child { node {3} }
  child { node {4} }
  child { node {5} }
;
\end{tikzpicture}
\end{document}
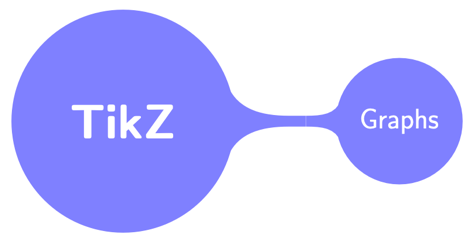
図 6.13 – 最小限のマインドマップ
\documentclass[tikz,border=10pt]{standalone}
\usetikzlibrary{mindmap}
\begin{document}
\begin{tikzpicture}[
    mindmap,
    concept color = blue!50,
    text = white,
  ]
  \node [concept, font=\Huge\sffamily\bfseries] {TikZ}
    child [clockwise from = 0] {
      node [concept, font=\Large\sffamily] {グラフ}
  };
\end{tikzpicture}
\end{document}
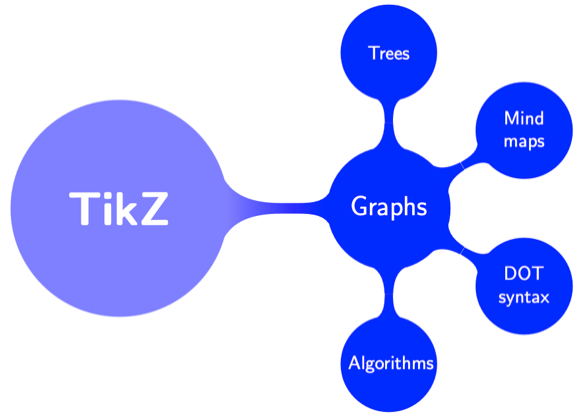
図 6.14 – ルートと2レベルを持つマインドマップ
\documentclass[tikz,border=10pt]{standalone}
\usetikzlibrary{mindmap}
\begin{document}
\begin{tikzpicture}[
  mindmap,
  text = white,
  concept color = blue!50,
  nodes = {concept},
  root/.append style = {
    font = \Huge\sffamily\bfseries},
  level 1 concept/.append style =
    {font = \Large\sffamily, sibling angle=90},
  level 2 concept/.append style =
    {font = \normalsize\sffamily}
  ]
  \node [root] {TikZ} [clockwise from=0]
    child [concept color=blue] {
      node {グラフ} [clockwise from=90]
        child { node {ツリー} }
        child { node {マインドマップ} }
        child { node {DOT構文} }
        child { node {アルゴリズム} }
    };
\end{tikzpicture}
\end{document}
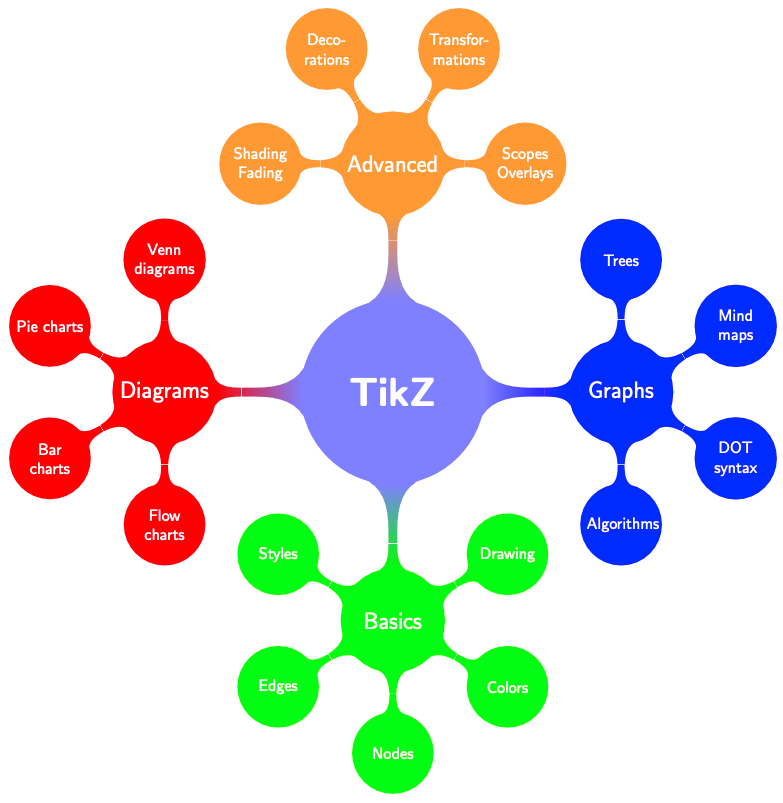
図 6.15 – 包括的なマインドマップ
\documentclass[tikz,border=10pt]{standalone}
\usetikzlibrary{mindmap}
\begin{document}
\begin{tikzpicture}[
  mindmap,
  text = white,
  concept color = blue!50,
  nodes = {concept},
  root/.append style = {
    font = \Huge\sffamily\bfseries},
  level 1 concept/.append style =
    {font = \Large\sffamily, sibling angle=90},
  level 2 concept/.append style =
    {font = \normalsize\sffamily}
  ]
  \node [root] {TikZ} [clockwise from=0]
    child [concept color=blue] {
      node {グラフ} [clockwise from=90]
        child { node {ツリー} }
        child { node {マインドマップ} }
        child { node {DOT構文} }
        child { node {アルゴリズム} }
    }
    child [concept color=green] {
      node {基本} [clockwise from=30]
        child { node {描画} }
        child { node {色} }
        child { node {ノード} }
        child { node {エッジ} }
        child { node {スタイル} }
    }
    child [concept color=red] {
      node {図} [clockwise from=-90]
        child { node {フローチャート} }
        child { node {バーチャート} }
        child { node {パイチャート} }
        child { node {ヴェン図} }
    }
    child [concept color=orange!80] {
      node {上級} [clockwise from=180]
        child { node {シェーディング\\フェーディング} }
        child { node {デコレーション} }
        child { node {変形} }
        child { node {スコープ\\オーバーレイ} }
    };
\end{tikzpicture}
\end{document}
グラフの作成

図 6.16 – 単純なグラフ
\documentclass[tikz,border = 10pt]{standalone}
\usetikzlibrary{graphs}
\begin{document}
\begin{tikzpicture}[nodes = {text depth = 1ex,
    text height = 2ex}]
  \graph { tex -> dvi -> ps -> pdf };
\end{tikzpicture}
\end{document}
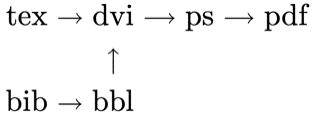
図 6.17 – ノードチェーンのグラフ
\documentclass[tikz,border = 10pt]{standalone}
\usetikzlibrary{graphs}
\begin{document}
\begin{tikzpicture}[nodes = {text depth = 1ex,
    text height = 2ex}]
  \graph { tex -> dvi -> ps -> pdf,
           bib -> bbl,
           bbl -> dvi };
\end{tikzpicture}
\end{document}
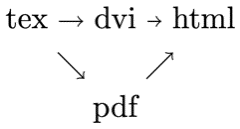
図 6.18 – ノードグループ
\documentclass[tikz,border = 10pt]{standalone}
\usetikzlibrary{graphs}
\begin{document}
\begin{tikzpicture}[nodes = {text depth = 1ex,
    text height = 2ex}]
  \graph { tex -> {dvi, pdf } -> html };
\end{tikzpicture}
\end{document}

図 6.19 – グラフ内のノード間距離
\documentclass[tikz,border = 10pt]{standalone}
\usetikzlibrary{graphs}
\begin{document}
\begin{tikzpicture}[nodes = {text depth = 1ex,
    text height = 2ex}]
  \graph [grow right = 2cm] { tex -> dvi -> ps -> pdf };
\end{tikzpicture}
\end{document}

図 6.20 – エッジのクオートを持つグラフ
\documentclass[tikz,border = 10pt]{standalone}
\usetikzlibrary{graphs,quotes}
\begin{document}
\begin{tikzpicture}[nodes = {text depth = 1ex,
    text height = 2ex},
    every edge quotes/.style = {font=\tiny\ttfamily,
  above, inner sep = 0pt}]
  \graph [grow right = 2cm]
    { tex -> ["latex"] dvi
          -> ["dvips"] ps -> ["ps2pdf"] pdf };
\end{tikzpicture}
\end{document}
マトリックス内の配置

図 6.21 – 単純なマトリックスノード
\documentclass[tikz,border = 10pt]{standalone}
\begin{document}
\begin{tikzpicture}
  \node[matrix,draw]  {
    \node{A}; & \node{B}; & \node{C}; \\
    \node{D}; & \node{E}; & \node{F}; \\
  };
\end{tikzpicture}
\end{document}
マトリックスライブラリを使用
\documentclass[tikz,border = 10pt]{standalone}
\usetikzlibrary{matrix}
\begin{document}
\begin{tikzpicture}
  \matrix[matrix of nodes, draw] {
    A & B & C \\
    D & E & F \\
  };
\end{tikzpicture}
\end{document}
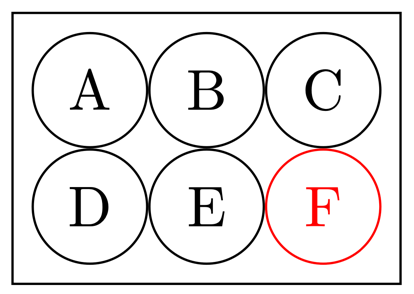
図 6.22 – スタイルオプションを持つマトリックスセルノード
\documentclass[tikz,border = 10pt]{standalone}
\usetikzlibrary{matrix}
\begin{document}
\begin{tikzpicture}
  \matrix [matrix of nodes, draw,
      nodes = {circle, draw, minimum width=2em} ] {
    A & B & C \\
    D & E & |[red]|F \\
   };
\end{tikzpicture}
\end{document}
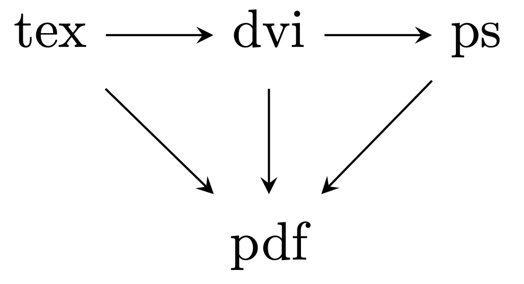
図 6.23 – 矢印を持つマトリックス図
\documentclass[tikz,border = 10pt]{standalone}
\usetikzlibrary{matrix}
\begin{document}
\begin{tikzpicture}
  \matrix (m) [matrix of nodes,
    row sep = 2em, column sep = 2em,
    nodes = {text depth = 1ex, text height = 2ex}
  ]
  {
    tex & dvi & ps \\
        & pdf &    \\
  };
  \draw [-stealth]
    (m-1-1) edge (m-1-2)
    (m-1-2) edge (m-1-3)
    (m-1-1) edge (m-2-2)
    (m-1-2) edge (m-2-2)
    (m-1-3) edge (m-2-2)
  ;
\end{tikzpicture}
\end{document}
Named matrix nodes
\documentclass[tikz,border = 10pt]{standalone}
\usetikzlibrary{matrix}
\begin{document}
\begin{tikzpicture}
  \matrix (m) [matrix of nodes,
    row sep = 2em, column sep = 2em,
    nodes = {text depth = 1ex, text height = 2ex}
  ]
  {
    tex & |(d)|dvi & ps \\
        & |(p)|pdf &    \\
  };
  \draw (d) -- (p);
\end{tikzpicture}
\end{document}
次の章 へ進む.