こちらはこの章のコード例です。これらのページは現在、時間をかけて更新されています(画像、キャプションの追加、おそらくさらなる例の追加)。更新のためにもう一度訪れてください。もちろん、このページを説明が得られる本と一緒に使用するのが最善の方法です。
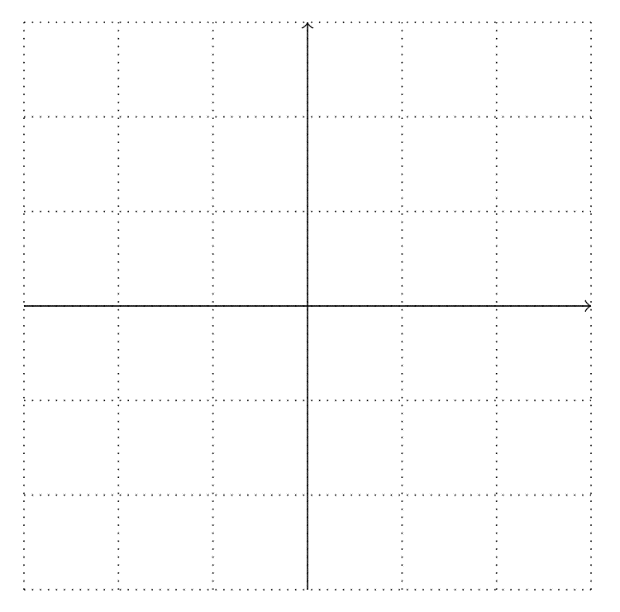
図2.1 – 長方形のグリッド
\documentclass[tikz,border=10pt]{standalone}
\begin{document}
\begin{tikzpicture}
  \draw[thin,dotted] (-3,-3) grid (3,3);
  \draw[->] (-3,0) -- (3,0);
  \draw[->] (0,-3) -- (0,3);
\end{tikzpicture}
\end{document}
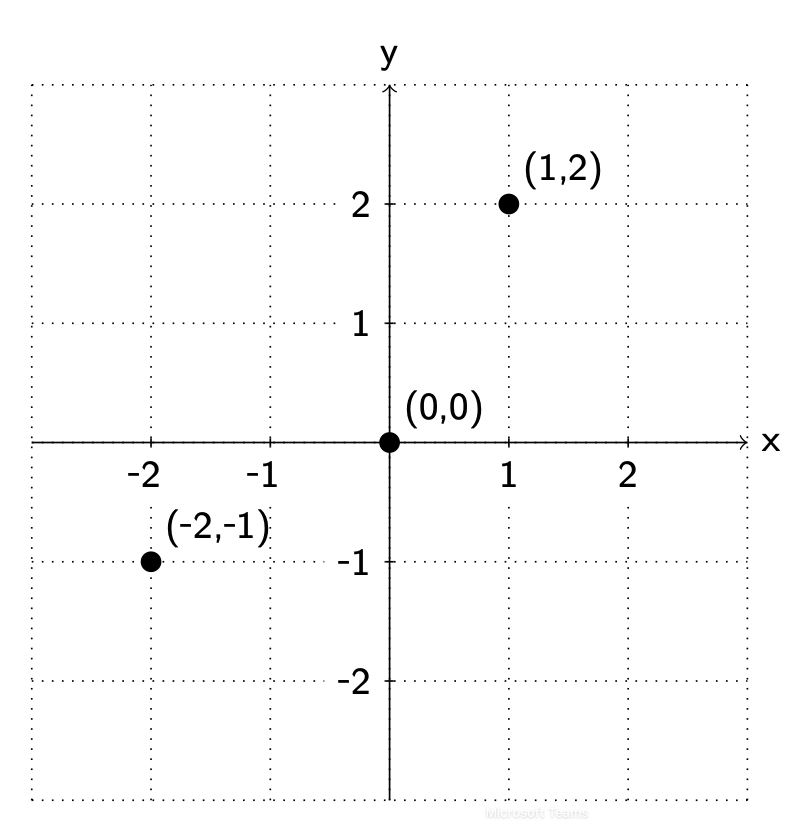
図2.2 – 直交座標系
(本のチュートリアルコードではありませんが、私のイラストレーションのソースコードです)
\documentclass[tikz,border=10pt]{standalone}
\usetikzlibrary{calc}
\newcommand{\minus}{\raisebox{0.96pt}{-}}
\begin{document}
\begin{tikzpicture}[every node/.style={font=\sffamily\small}]
  \draw[thin,dotted] (-3,-3) grid (3,3);
  \draw[->] (-3,0) -- (3,0) node[right] {x};
  \draw[->] (0,-3) -- (0,3) node[above] {y};
  \foreach \x/\xlabel in {-2/{\minus 2\hphantom{-}}, -1/{\minus 1\hphantom{-}}, 1/1, 2/2}
    \draw (\x cm,1pt ) -- (\x cm,-1pt ) node[anchor=north,fill=white] {\xlabel};
  \foreach \y/\ylabel in {-2/{\minus 2}, -1/{\minus 1}, 1/1, 2/2}
    \draw (1pt,\y cm) -- (-1pt ,\y cm) node[anchor=east, fill=white] {\ylabel};
\end{tikzpicture}
\end{document}
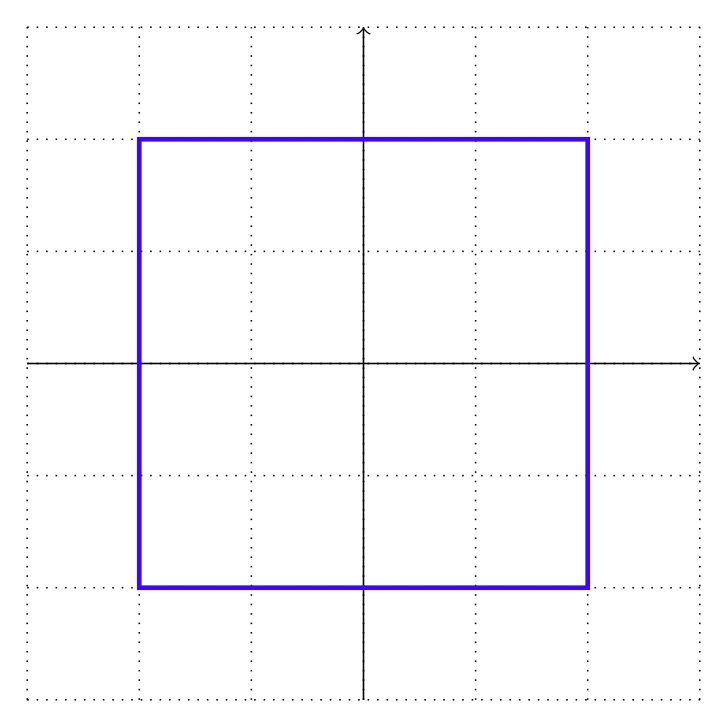
図2.3 – 直交座標での正方形
\documentclass[tikz,border=10pt]{standalone}
\begin{document}
\begin{tikzpicture}
  \draw[thin,dotted] (-3,-3) grid (3,3);
  \draw[->] (-3,0) -- (3,0);
  \draw[->] (0,-3) -- (0,3);
  \draw[very thick, blue] (-2,-2) -- (-2,2)
  -- (2,2) -- (2,-2) -- cycle;
\end{tikzpicture}
\end{document}
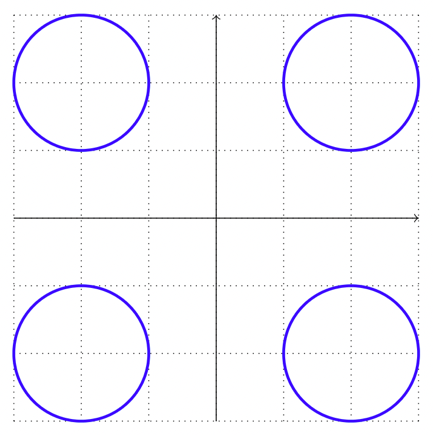
図2.4 – 直交座標での円
\documentclass[tikz,border=10pt]{standalone}
\begin{document}
\begin{tikzpicture}
  \draw[thin,dotted] (-3,-3) grid (3,3);
  \draw[->] (-3,0) -- (3,0);
  \draw[->] (0,-3) -- (0,3);
  \draw[very thick, blue] (-2,-2) circle (1) (-2,2)
    circle (1) (2,2) circle (1) (2,-2) circle (1);
\end{tikzpicture}
\end{document}
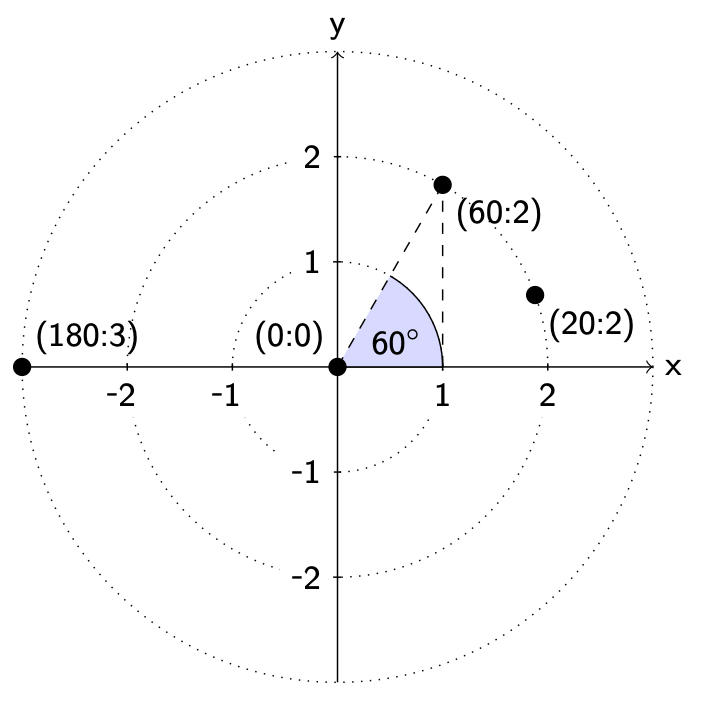
図2.5 – 極座標系
(本のチュートリアルコードではありませんが、私のイラストレーションのソースコードです)
\documentclass[tikz,border=10pt]{standalone}
\usetikzlibrary{calc}
\newcommand{\minus}{\raisebox{0.96pt}{-}}
\begin{document}
\begin{tikzpicture}[every node/.style={font=\sffamily\small}]
  \draw[thin,dotted] circle (1) circle (2) circle (3);
  \draw[->] (-3,0) -- (3,0) node[right] {x};
  \draw[->] (0,-3) -- (0,3) node[above] {y};
  \foreach \x/\xlabel in {-2/{\minus 2\hphantom{-}}, -1/{\minus 1\hphantom{-}}, 1/1, 2/2}
    \draw (\x cm,1pt ) -- (\x cm,-1pt ) node[anchor=north,fill=white] {\xlabel};
  \foreach \y/\ylabel in {-2/{\minus 2}, -1/{\minus 1}, 1/1, 2/2}
    \draw (1pt,\y cm) -- (-1pt ,\y cm) node[anchor=east, fill=white] {\ylabel};
  \draw[fill=black] (60:2) circle (0.08)   node[below right] {(60:2)};
  \draw [fill=blue!15](0,0) -- (1,0) arc (0:60:1cm);
  \draw[fill=black] circle (0.08) node[above left] {(0:0)}
    node [above right,xshift=0.2cm] {60${}^\circ$};
  \draw [dashed](0,0) -- (60:2);
  \draw [dashed](1,0) -- (60:2);
  \draw[fill=black] (20:2) circle (0.08)   node[below right] {(20:2)};
  \draw[fill=black] (180:3) circle (0.08)   node[above right] {(180:3)};
\end{tikzpicture}
\end{document}
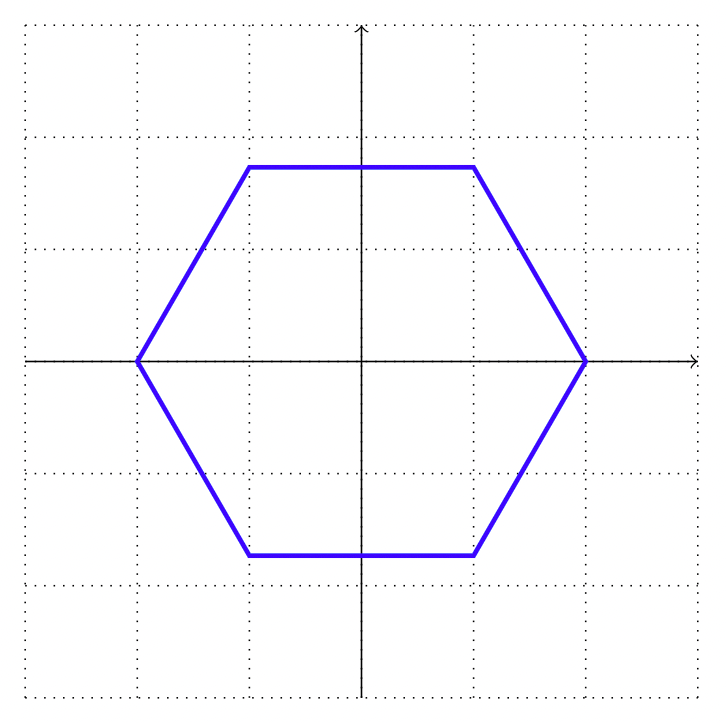
図2.6 – 極座標での六角形
\documentclass[tikz,border=10pt]{standalone}
\begin{document}
\begin{tikzpicture}
  \draw[thin,dotted] (-3,-3) grid (3,3);
  \draw (-3,0) -- (3,0);
  \draw (0,-3) -- (0,3);
  \draw[very thick, blue] (0:2) -- (60:2) -- (120:2)
    -- (180:2) --(240:2) -- (300:2) -- cycle;
\end{tikzpicture}
\end{document}
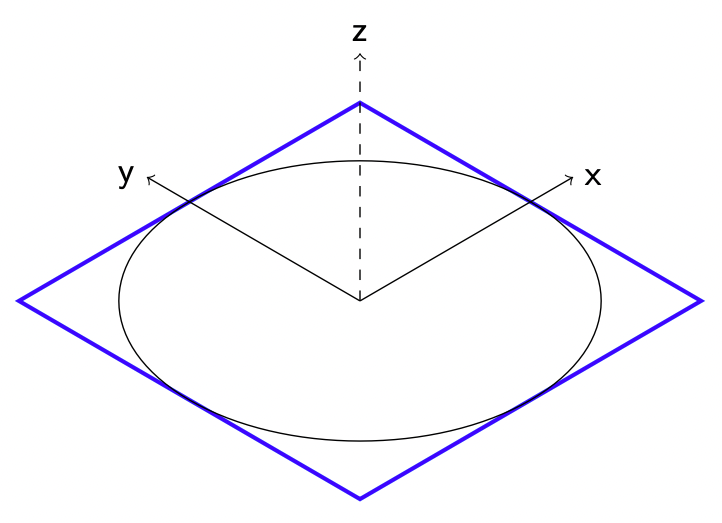
図2.7 – 三次元での正方形と円
\documentclass[tikz,border=10pt]{standalone}
\begin{document}
\begin{tikzpicture}[y={(-0.86cm,0.5cm)},x={(0.86cm,0.5cm)}, z={(0cm,1cm)},font=\sffamily]
  \draw[very thick, blue] (-2,-2,0) -- (-2,2,0) -- (2,2,0) -- (2,-2,0) -- cycle;
  \draw[->] (0,0,0) -- (2.5, 0,  0) node [right] {x};
  \draw[->] (0,0,0) -- (0,  2.5, 0) node [left] {y};
  \draw[->,dashed] (0,0,0) -- (0,  0, 2.5) node [above] {z};
  \draw circle (2);
\end{tikzpicture}
\end{document}
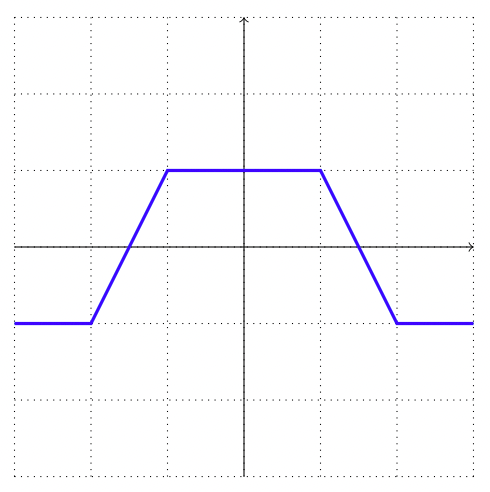
図2.8 – 相対座標を用いた描画
\documentclass[tikz,border=10pt]{standalone}
\begin{document}
\begin{tikzpicture}
  \draw[thin,dotted] (-3,-3) grid (3,3);
  \draw[->] (-3,0) -- (3,0);
  \draw[->] (0,-3) -- (0,3);
  \draw[very thick, blue] (-3,-1) -- +(1,0) -- +(2,2) -- +(4,2) --+(5,0) -- + (6,0);
\end{tikzpicture}
\end{document}
Alternative syntax:
\documentclass[tikz,border=10pt]{standalone}
\begin{document}
\begin{tikzpicture}
  \draw[thin,dotted] (-3,-3) grid (3,3);
  \draw[->] (-3,0) -- (3,0);
  \draw[->] (0,-3) -- (0,3);
  \draw[very thick, blue] (-3,-1) -- ++(1,0) -- ++(1,2) -- ++(2,0) --++ (1,-2) -- ++ (1,0);
\end{tikzpicture}
\end{document}
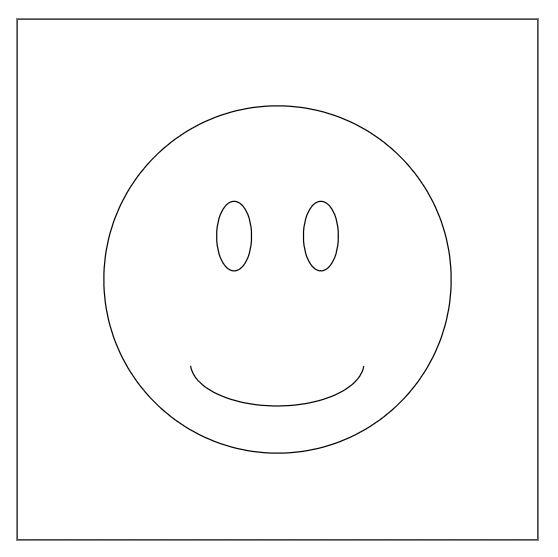
図2.9 – 長方形の中のスマイリー
\documentclass[tikz,border=10pt]{standalone}
\begin{document}
\begin{tikzpicture}
  \draw (0,0) circle [radius=2];
  \draw (-0.5,0.5,0) ellipse [x radius=0.2, y radius=0.4];
  \draw (0.5,0.5) ellipse [x radius=0.2, y radius=0.4];
  \draw (-1,-1) arc [start angle=185, end angle=355,
    x radius=1, y radius=0.5];
  \draw (-3,-3) rectangle (3,3);
\end{tikzpicture}
\end{document}

図2.10 – 色付きのスマイリー
\documentclass[tikz,border=10pt]{standalone}
\begin{document}
\begin{tikzpicture}
  \draw[fill=yellow] (0,0) circle [radius=2];
  \draw[fill=black] (-0.5,0.5,0) ellipse [x radius=0.2, y radius=0.4];
  \draw[fill=black] (0.5,0.5,0) ellipse [x radius=0.2, y radius=0.4];
  \draw[very thick] (-1,-1) arc [start angle=185, end angle=355,
    x radius=1, y radius=0.5];
\end{tikzpicture}
\end{document}

図2.11 – 三次元的な外観を持つスマイリー
\documentclass[tikz,border=10pt]{standalone}
\begin{document}
\begin{tikzpicture}
  \draw[shading=ball, ball color=yellow] (0,0) circle [radius=2];
  \draw[shading=ball, ball color=black] (-0.5,0.5,0) ellipse [x radius=0.2, y radius=0.4];
  \draw[shading=ball, ball color=black] (0.5,0.5,0) ellipse [x radius=0.2, y radius=0.4];
  \draw[very thick] (-1,-1) arc [start angle=185, end angle=355,
    x radius=1, y radius=0.5];
\end{tikzpicture}
\end{document}
次の章 へ進む.