こちらはこの章のコード例です。これらのページは現在、時間をかけて更新されています(画像、キャプションの追加、おそらくさらなる例の追加)。更新のためにもう一度訪れてください。もちろん、このページを説明が得られる本と一緒に使用するのが最善の方法です。
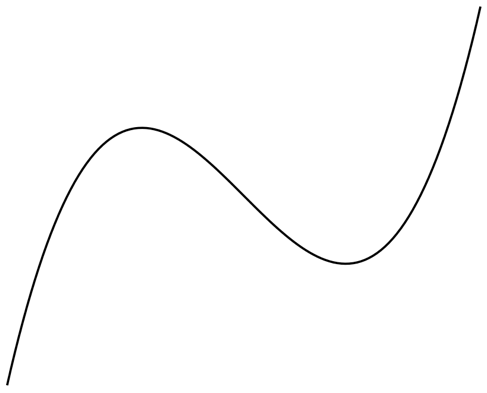
図12.1 – 座標やパラメータなしのサンプル曲線
\documentclass[border=10pt]{standalone}
\usepackage{pgfplots}
\begin{document}
\begin{tikzpicture}
  \begin{axis}[axis lines=none]
    \addplot [domain=-3:3, smooth, thick] { x^3 - 5*x };
  \end{axis}
\end{tikzpicture}
\end{document}
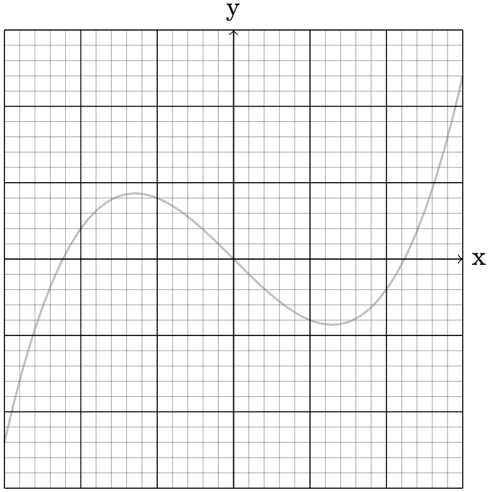
図12.2 – グリッド付きの曲線
\documentclass[border=10pt]{standalone}
\usepackage{pgfplots}
\begin{document}
\begin{tikzpicture}
  \draw[domain=-3:3,samples=50,color=gray!50,thick] plot (\x, \x^3/5 - \x);
  \draw[very thin,gray,step=.2] (-3,-3) grid (3,3);
  \draw[step=1] (-3,-3) grid (3,3);
  \draw[->] (-3,0) -- (3,0) node[right] {x};
  \draw[->] (0,-3) -- (0,3) node[above] {y};
\end{tikzpicture}
\end{document}
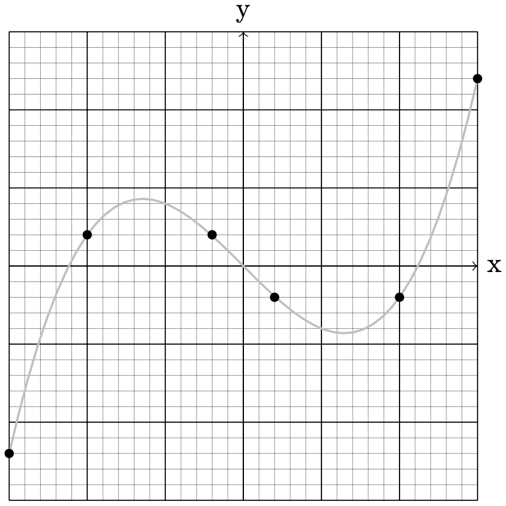
図12.3 – 曲線上の手動選択ポイント
\documentclass[border=10pt]{standalone}
\usepackage{pgfplots}
\begin{document}
\begin{tikzpicture}
  \draw[domain=-3:3,samples=50,color=gray!50,thick] plot (\x, \x^3/5 - \x);
  \draw[very thin,gray,step=.2] (-3,-3) grid (3,3);
  \draw[step=1] (-3,-3) grid (3,3);
  \draw[->] (-3,0) -- (3,0) node[right] {x};
  \draw[->] (0,-3) -- (0,3) node[above] {y};
  \foreach \x/\y in {-3/-2.4, -2/0.4, -0.4/0.4, 0.4/-0.4, 2/-0.4, 3/2.4}
    \fill (\x,\y) circle (0.6mm);
\end{tikzpicture}
\end{document}
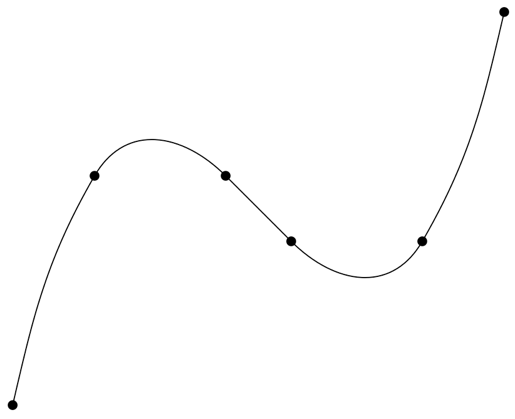
図12.4 – 点を通るなめらかなパス
\documentclass[border=10pt]{standalone}
\usepackage{pgfplots}
\begin{document}
\begin{tikzpicture}
  \draw[domain=-3:3,samples=50,color=gray!50,thick] plot (\x, \x^3/5 - \x);
  \foreach \x/\y in { -3/-2.4, -2/0.4, -0.4/0.4,
    0.4/-0.4, 2/-0.4, 3/2.4 }
      \fill (\x,\y) circle (0.6mm);
  \draw (-3,-2.4) to[out=77,in=240] (-2,0.4)
    to[out=60,in=135, looseness=1.2] (-0.4,0.4) to[out=-45,in=135] (0.4,-0.4)
    to[out=-45,in=-120,looseness=1.2] (2,-0.4) to[out=60,in=257] (3,2.4);
\end{tikzpicture}
\end{document}
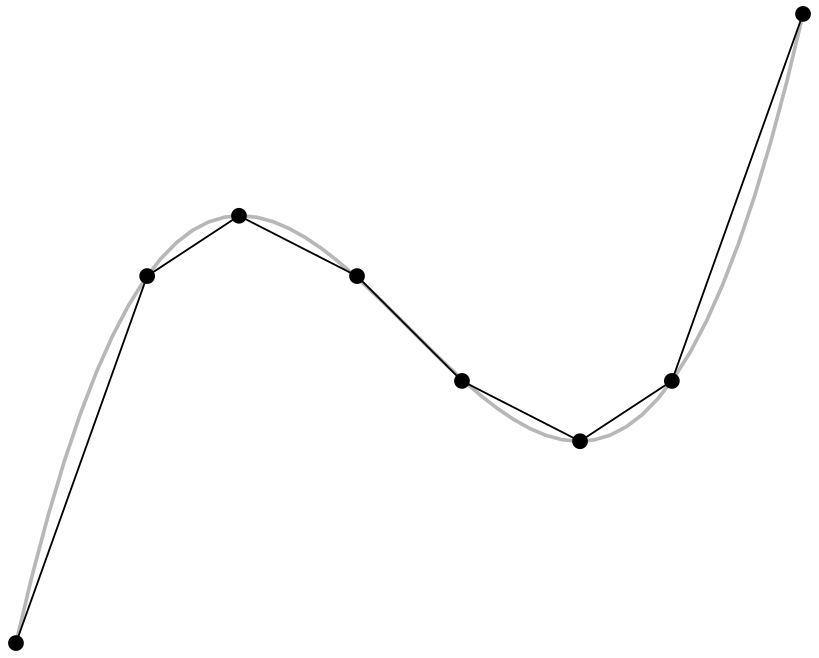
図12.5 – 与えられた座標を通るプロット
\documentclass[border=10pt]{standalone}
\usepackage{pgfplots}
\begin{document}
\begin{tikzpicture}
  \draw[domain=-3:3,samples=50,color=gray!50,thick] plot (\x, \x^3/5 - \x);
  \foreach \x/\y in { -3/-2.4, -2/0.4, -0.4/0.4,
    0.4/-0.4, 2/-0.4, 3/2.4 }
      \fill (\x,\y) circle (0.6mm);
  \draw plot coordinates {
    (-3,-2.4) (-2,0.4) (-1.3,0.86) (-0.4,0.4)
    (0.4,-0.4) (1.3,-0.86) (2,-0.4) (3,2.4) };
\end{tikzpicture}
\end{document}
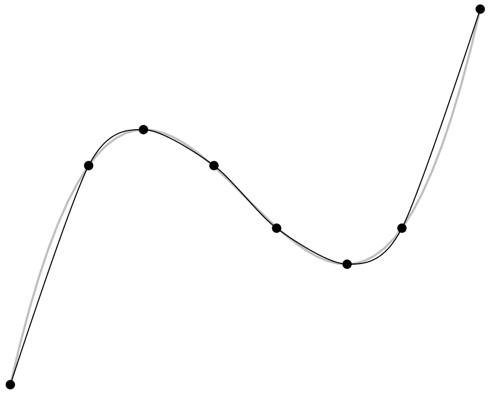
図12.6 – 与えられた座標を通るなめらかなプロット
\documentclass[border=10pt]{standalone}
\usepackage{pgfplots}
\begin{document}
\begin{tikzpicture}
  \draw[domain=-3:3,samples=50,color=gray!50,thick] plot (\x, \x^3/5 - \x);
  \foreach \x/\y in { -3/-2.4, -2/0.4, -0.4/0.4,
    0.4/-0.4, 2/-0.4, 3/2.4 }
      \fill (\x,\y) circle (0.6mm);
  \draw plot[smooth] coordinates {
    (-3,-2.4) (-2,0.4) (-1.3,0.86) (-0.4,0.4)
    (0.4,-0.4) (1.3,-0.86) (2,-0.4) (3,2.4) };
\end{tikzpicture}
\end{document}
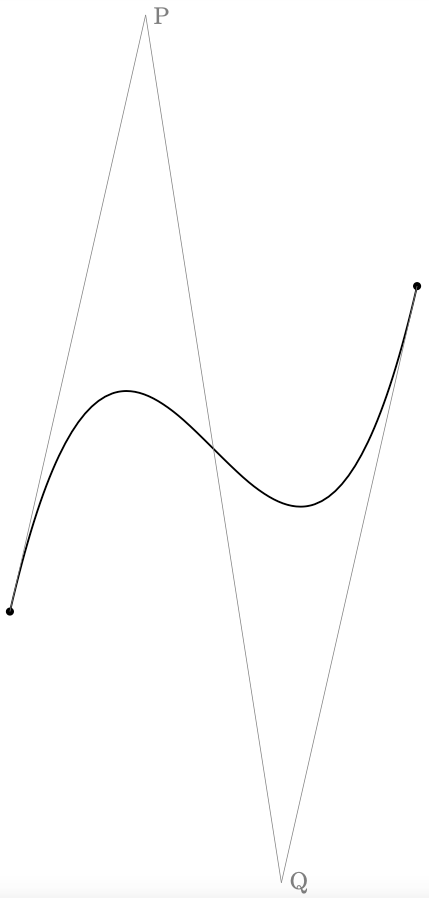
図12.7 – 制御点付きのベジェ曲線
\documentclass[tikz,border=10pt]{standalone}
\begin{document}
\begin{tikzpicture}
  \foreach \x/\y in { -3/-2.4, 3/2.4 }
      \fill (\x,\y) circle (0.6mm);
  \draw[thick] (-3,-2.4) .. controls +(77:9) and +(257:9) .. (3,2.4);
  \draw[help lines] (-3,-2.4) -- (-1,6.4) node[right] {P};
  \draw[help lines] (3,2.4) -- (1,-6.4) node[right] {Q};
  \draw[help lines] (-1,6.4) -- (1,-6.4);
\end{tikzpicture}
\end{document}
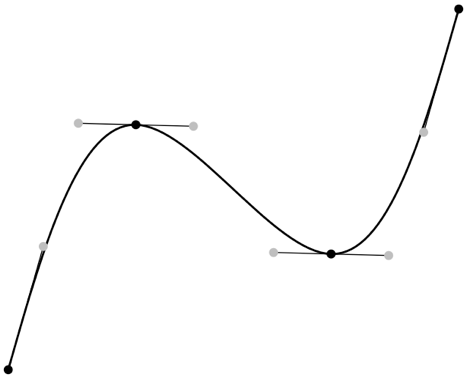
図12.8 – ベジェスプラインを使用した曲線
\documentclass[tikz,border=10pt]{standalone}
\usetikzlibrary{spline}
\begin{document}
\begin{tikzpicture}
%  \draw[thin,dotted] (-3,-3) grid (3,3);
%  \draw[->] (-3,0) -- (3,0);
%  \draw[->] (0,-3) -- (0,3);
  %\draw[domain=-3:3,samples=50,color=gray!50,thick] plot (\x, \x^3/5 - \x);
  \foreach \x/\y in { -3/-2.4, -1.3/0.86,
    1.3/-0.86, 3/2.4 }
      \fill (\x,\y) circle (0.6mm);
%  \coordinate (A) at (-3,-2.4);
%  \coordinate (B) at (-1.3,0.86);
%  \coordinate (C) at (1.3,-0.86);
%  \coordinate (D) at (3,2.4);
  \draw[thick] (-3,-2.4) to[spline coordinates=S, spline through={(-1.3,0.86)(1.3,-0.86)}] (3,2.4);
  \foreach \i [evaluate=\i as \j using \i+1] in {1,2,...,\tikzsplinesegments} {
    \draw[thin]  (S K-\i) -- (S P-\i)
                      (S K-\j) -- (S Q-\i);
    \fill[gray!50,semithick] (S P-\i) circle (0.6mm);
    \fill[gray!50,semithick] (S Q-\i) circle (0.6mm);
  }
\end{tikzpicture}
\end{document}
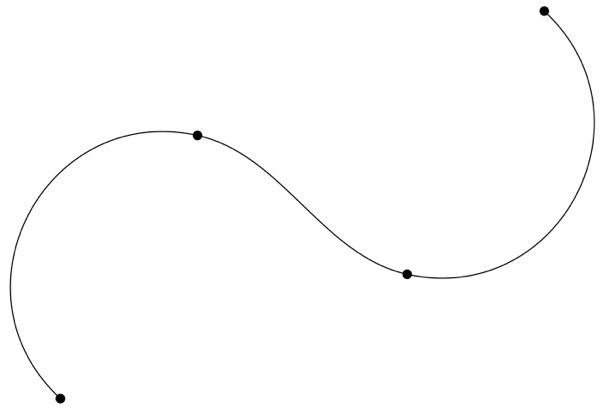
図12.9 – ホビーカーブ
\documentclass[tikz,border=10pt]{standalone}
\usetikzlibrary{hobby}
\begin{document}
\begin{tikzpicture}
  \foreach \x/\y in { -3/-2.4, -1.3/0.86,
    1.3/-0.86, 3/2.4 }
      \fill (\x,\y) circle (0.6mm);
  \draw plot[hobby,thick] coordinates { (-3,-2.4) (-1.3,0.86) (1.3,-0.86) (3,2.4)};
\end{tikzpicture}
\end{document}

図12.10 – 閉じたなめらかな曲線
\documentclass[tikz,border=10pt]{standalone}
\usetikzlibrary{hobby}
\begin{document}
\begin{tikzpicture}
  \foreach \x/\y in { -3/-2.4, -1.3/0.86,
    1.3/-0.86, 3/2.4 }
      \fill (\x,\y) circle (0.6mm);
  \draw (-3,-2.4) to[closed, curve through = {(-1.3,0.86) (1.3,-0.86)}] (3,2.4);
\end{tikzpicture}
\end{document}
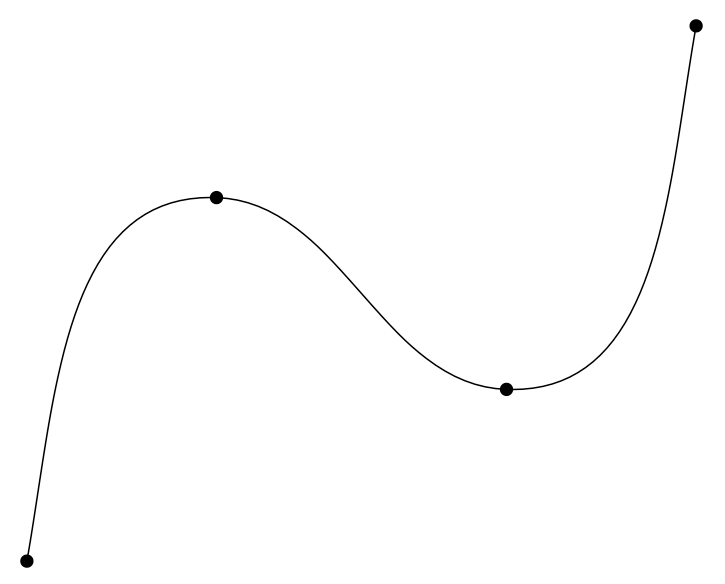
図12.11 – 特定の開始角と終了角を持つ曲線
\documentclass[tikz,border=10pt]{standalone}
\usetikzlibrary{hobby}
\begin{document}
\begin{tikzpicture}
  \foreach \x/\y in { -3/-2.4, -1.3/0.86,
    1.3/-0.86, 3/2.4 }
      \fill (\x,\y) circle (0.6mm);
  \draw (-3,-2.4) to[out angle=80, in angle=260,
    curve through = {(-1.3,0.86) (1.3,-0.86)}] (3,2.4);
\end{tikzpicture}
\end{document}
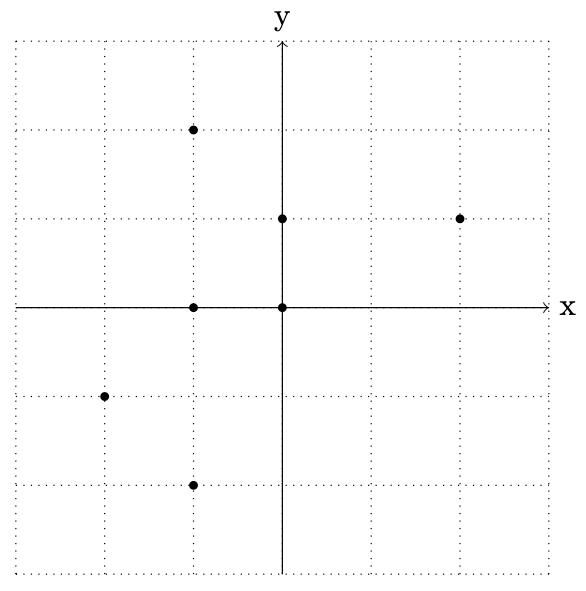
図12.12 – 平面上の点
\documentclass[tikz,border=10pt]{standalone}
\usetikzlibrary{hobby}
\begin{document}
\begin{tikzpicture}
  \draw[step=1,thin,dotted] (-3,-3) grid (3,3);
  \draw[->] (-3,0) -- (3,0) node[right] {x};
  \draw[->] (0,-3) -- (0,3) node[above] {y};
  \foreach \c in {(0,0),(-1,-2),(-2,-1),(-1,0),
    (-1,2),(0,1),(2,1)} \fill \c circle (0.5mm);
\end{tikzpicture}
\end{document}
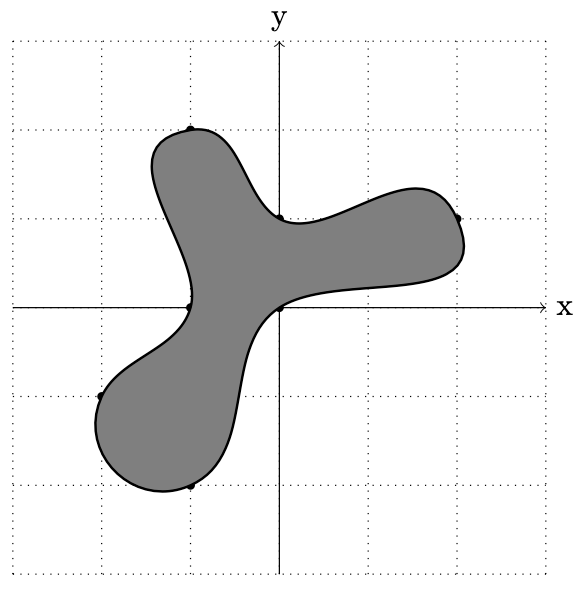
図12.13 – 平面上の点を通る非常になめらかな曲線
\documentclass[tikz,border=10pt]{standalone}
\usetikzlibrary{hobby}
\begin{document}
\begin{tikzpicture}
  \draw[step=1,thin,dotted] (-3,-3) grid (3,3);
  \draw[->] (-3,0) -- (3,0) node[right] {x};
  \draw[->] (0,-3) -- (0,3) node[above] {y};
  \foreach \c in {(0,0),(-1,-2),(-2,-1),(-1,0),
    (-1,2),(0,1),(2,1)} \fill \c circle (0.5mm);
  \draw[thick, fill=gray] (0,0) to[closed, curve through =
    { (-1,-2) (-2,-1) (-1,0) (-1,2) (0,1) }] (2,1);
\end{tikzpicture}
\end{document}
次の章 へ進む.