Here’s the Japanese translation for your detailed description:
PGFplots.netの開始後、私はpgfplotsでさらに実験をしました。私がいつものように各グラフィックソフトウェアで行うように、フラクタルをどのように表現できるか、そしてそれによって有用または興味深い側面があるかどうかを考えました。ここでは速度やメモリスペースは二次的なもので、時間とともに容量は変わります。
私が興味を持っているのは、例えば
- 反復的に定義された関数を渡してプロットできるか
- イテレーション数のように、カラーマップ(colormaps)を利用できるか
- イテレーション関数システム(IFS、バーンズリー・ファーンなど)のように、幾何学的変換がうまく使えるか
- 三次元でも可能か
以下では、Luaで実装されたアルゴリズムを使用してマンデルブロ集合をプロットします。LaTeXで表現すると、以下のようになります:
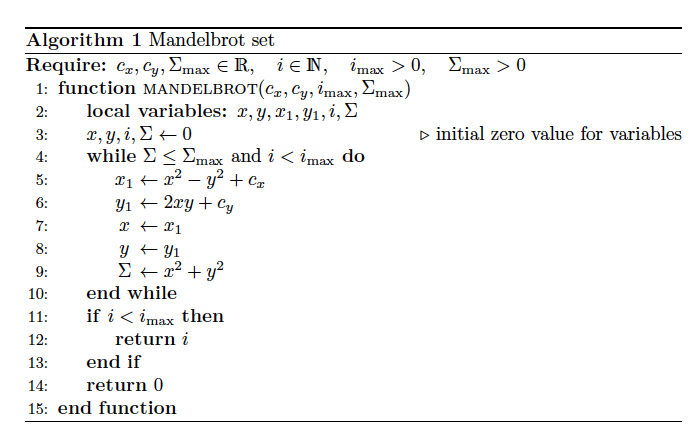
次のコードはLuaとpgfplotsを使用した実装です:
%!TEX lualatex
\documentclass[border=10pt]{standalone}
\usepackage{pgfplots}
\pgfplotsset{width=7cm, compat=1.18}
\usepackage{luacode}
\begin{luacode}
  function mandelbrot(cx, cy, imax, smax)
    local x, y, x1, y1, i, s
    x, y, i, s = 0, 0, 0, 0
    while (s <= smax) and (i < imax)  do
      x1 = x * x - y * y + cx
      y1 = 2 * x * y + cy
      x = x1
      y = y1
      i = i + 1
      s = x * x + y * y
    end
    if (i < imax) then
      tex.print(i)
    else
      tex.print(0)
    end
  end
\end{luacode}
\begin{document}
\begin{tikzpicture}
  \begin{axis}[
    colorbar,
    point meta max = 30,
    tick label style = {font=\tiny},
    view={0}{90}]
    \addplot3 [surf, domain = -1.5:0.5, shader = interp,
               domain y = -1:1, samples = 150]
        { \directlua{mandelbrot(\pgfmathfloatvalueof\x,
          \pgfmathfloatvalueof\y,5000,4)} };
  \end{axis}
\end{tikzpicture}
\end{document}
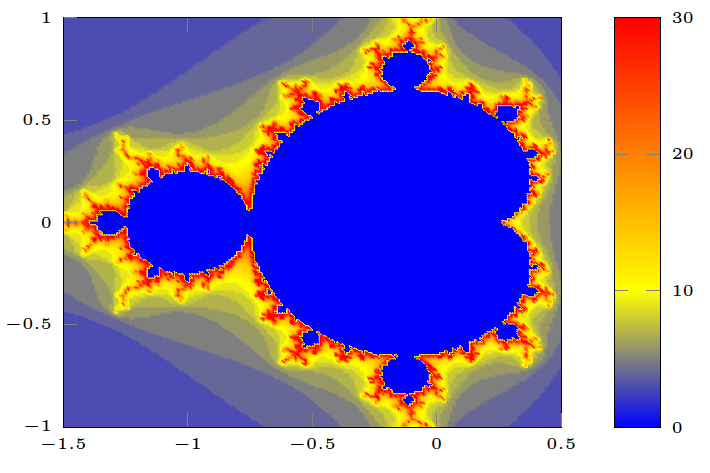
samplesとimaxの値を好きなだけ高く設定してください。コンパイルにはより多くの時間がかかります。すると、次の図が得られます:
アルゴリズムのレイアウトとコード例については、私のLaTeX Cookbookで説明されています:https://latex-cookbook.net/chapter-11
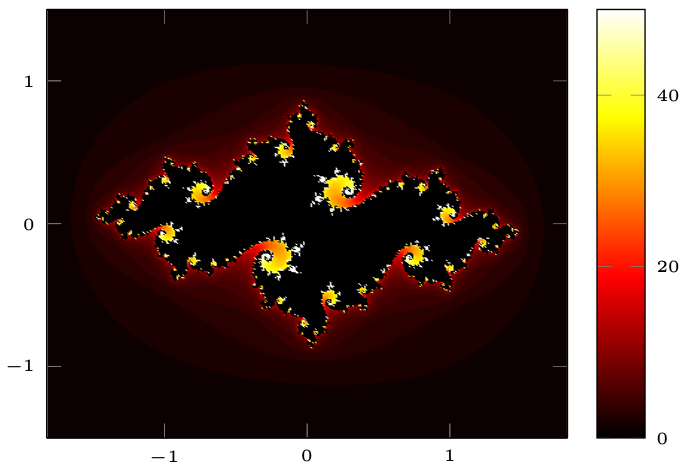
次の修正されたコードはジュリア集合を出力します:
%!TEX lualatex
\documentclass[border=10pt]{standalone}
\usepackage{pgfplots}
\pgfplotsset{width=7cm, compat=1.18}
\usepackage{luacode}
\begin{luacode}
  function julia(cx, cy, imax, smax)
    local x, y, x1, y1, i, s
    i, s = 0, 0, 0, 0
    x = cx
    y = cy
    while (s <= smax) and (i < imax)  do
      x1 = x * x - y * y - 0.742
      y1 = 2 * x * y + 0.1
      x = x1
      y = y1
      i = i + 1
      s = x * x + y * y
    end
    if (i < imax) then
      tex.print(i)
    else
      tex.print(0)
    end
  end
\end{luacode}
\begin{document}
\begin{tikzpicture}
  \begin{axis}[
    colormap/hot2,
    colorbar,
    axis equal,
    point meta max=50,
    tick label style={font=\tiny},
    view={0}{90}]
    \addplot3 [surf, domain = -1.82:1.82, shader = interp,
      domain y = -1.5:1.5, samples = 150]
      {\directlua{julia(\pgfmathfloatvalueof\x,\pgfmathfloatvalueof\y,5000,4)}
    };
  \end{axis}
\end{tikzpicture}
\end{document}
samplesとimaxの値を好きなだけ高く設定してください。コンパイルにはより多くの時間がかかります。すると、次の図が得られます: