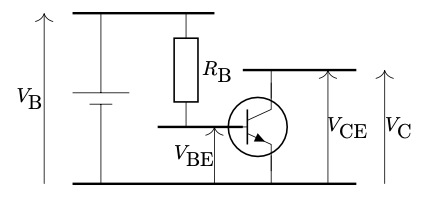
活性領域のときの電位図
\documentclass[tikz,border=10pt]{standalone}
\usepackage{circuitikz}
\begin{document}
\begin{tikzpicture}
\draw (0,0) node[npn,tr circle]{};
\draw[very thick](-0.5,0)--(-2,0);

\draw (-1.5,2)to[european resistor=$R_{\textmd{B}}$] (-1.5,0);
\draw[very thick](-1,2)--(-3.5,2);

\draw[-{>[scale=1.75]}](-4,-1)--(-4,2);
\draw(-4.25,0.5)node{$V_{\textmd{B}}$};
\draw(-3,2)--(-3,0.6);
\draw(-3,-1)--(-3,0.4);
\draw(-2.5,0.6)--(-3.5,0.6);
\draw(-2.8,0.4)--(-3.2,0.4);
\draw[-{>[scale=1.75]}](-1,-1)--(-1,0);
\draw(-1.35,-0.5)node{$V_{\textmd{BE}}$};

\draw[very thick](1.5,-1)--(-3.5,-1);

\draw(0,-0.5)--(0,-1);

\draw(0,0.5)--(0,1);
\draw[-{>[scale=1.75]}](1,-1)--(1,1);
\draw(1.35,0)node{$V_{\textmd{CE}}$};

\draw[-{>[scale=1.75]}](2,-1)--(2,1);
\draw(2.25,0)node{$V_{\textmd{C}}$};
\draw[very thick](-0.5,1)--(1.5,1);
\end{tikzpicture}
\end{document}
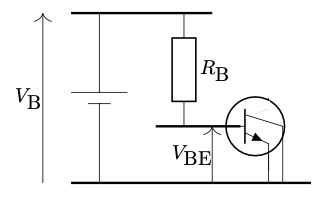
飽和領域のときの電位図
\documentclass[tikz,border=10pt]{standalone}
\usepackage{circuitikz}
\begin{document}
\begin{tikzpicture}
\draw (0,0) node[npn,tr circle]{};
\draw[very thick](-0.5,0)--(-2,0);

\draw (-1.5,2)to[european resistor=$R_{\textmd{B}}$] (-1.5,0);
\draw[very thick](-1,2)--(-3.5,2);

\draw[-{>[scale=1.75]}](-4,-1)--(-4,2);
\draw(-4.25,0.5)node{$V_{\textmd{B}}$};
\draw(-3,2)--(-3,0.6);
\draw(-3,-1)--(-3,0.4);
\draw(-2.5,0.6)--(-3.5,0.6);
\draw(-2.8,0.4)--(-3.2,0.4);
\draw[-{>[scale=1.75]}](-1,-1)--(-1,0);
\draw(-1.35,-0.5)node{$V_{\textmd{BE}}$};

\draw(0,-0.5)--(0,-1);
\draw[very thick,white](0,0.5)--(0,1);

\draw[very thick,white](0,0.45)--(0,0);
\draw[ultra  thick,white](0,0.285)--(-0.4,0.115);
\draw[very thick](0.75,-1)--(-3.5,-1);
\draw(-0.4,0.2)--(0.25,0)--(0.25,-1);
\end{tikzpicture}
\end{document}